Directors' Blog
Conference: Multicore World 2016
Conference Summary
15 – 17 February 2016
Shed 6, Queens Wharf – Wellington, New Zealand
Bringing together business and technical know-how of developing and deploying multicore and manycore based solutions (5th edition). Including panels and debates on: “HPC in the Cloud: the SKA example”and “TOPS: The Open Parallel Stack”
Multicore World is a global think-tank that allows you to network and learn about all aspects of multicore and manycore technology and business. Organised by Open Parallel since 2012, takes the pulse of this fast growing ecosystem: sessions cover latest developments in software and hardware, applications and the businesses behind these trends.
Find out about:
• Software for the enterprise in a complex world
• Machine Understanding: the future of the Data Centre
• Big Data and Internet of Things: scalability and industry applications
• Heterogeneous Computing and Exascale Computing
• TOPS: The OS for a Data Centre Rack Scale Computer
Browse through the program> openparallel.com/multicore-world-2016/program-2016
Conference Summary
Conference Schedule
Discount offer
25% discount on tickets purchased by February 12. Email danene.jones@auckland.ac.nz to find out how, or check out the February 10 newsletter.
Te Pūnaha Matatini Cycle Challenge
What: Te Pūnaha Matatini Cycle Challenge – join the team and commit to reducing your climate impact.
When: February 1 to 29
Where: From wherever you are across Aotearoa
Something wheely good is happening at Te Pūnaha Matatini HQ – Director Shaun Hendy bought a bicycle and Executive Manager Kate Hannah is riding to work! As a result, the whole HQ team has committed to reducing our climate impact by starting a February bike challenge.
You can take part by using the #tpmride hashtag on Twitter. Post us your ride to work photos and tell us how many kilometres you’ve clocked up.
Auckland riders> sign up to the Te Pūnaha Matatini Auckland Bike Challenge team and log all your rides.
Tips for reducing your climate impact
Check out this Motu post that features research by Suzi Kerr, a Motu senior fellow and TPM principal investigator, on tips about how Kiwis can reduce their climate impacts.
NSSI (Not Such a Silly Idea… but do it properly) #4
By Catherine Webb and Nicola Gujer
A long time ago in a galaxy far, far away, we started deconstructing the National Statement of Science Investment and considering the claims it makes.
Our first blog post ended with an unanswered question – is the proportion of a country’s papers in the global top 10% of citations a good way (or at least the best available way) to measure science excellence? The NSSI’s definition of excellent science is “well-designed, well-performed, well-reported research, recognised as such, e.g. through peer review.”
In preparation for our first blog post, we were dealing with a graph that suggested New Zealand produces science which is not quite as ‘excellent’ as our comparative small advanced economies, because a lower percentage of our publications make it into the 10% most cited publications worldwide. In that post, we discussed the limitations of that graph, but nonetheless concluded that it does show New Zealand lagging slightly in the production of ‘top-shelf science’.
Still, we were curious to see whether there are any more useful ways of measuring ‘science excellence’ that might paint a different picture.
What if just looking at the papers with the most citations is not the right approach? Are citations a good way to measure excellence at all? One flaw with citations is that papers can become highly cited for two reasons: by being amazing, or by being such poor science that everyone wants to correct it (like Wolfe-Simon’s paper on a bacterium that thrives on arsenic). Also, as we discussed in our second post, citations tend to follow a ‘rich-get-richer’ power-law distribution, which makes a well-known paper garner even more citations, while another paper, nearly as good, can dwell in obscurity all its life.
However, even if citations are not a great way, they may currently be the least-bad way of assessing the impact of publications. But what kind of citations should we use to compare countries? Every country has different areas of specialty, and if they are alone in that area, they may not be cited very much by other countries, even if their science is top-notch. New Zealand, for example, is environmentally isolated and unique. Our conservation or agricultural papers for instance may not be of immediate relevance to anyone else as much as they are to us. If our science is rather useful to ourselves, but not to the rest of the world – should that make it less ‘excellent’?
We broke the data down into only intranational citations per publication and only international.
Because international citations make up the vast majority of any small country’s citations, these have the greatest impact on the percentage of publications in the 10% most cited. Thus, in terms of ranking countries, these two measures of ‘excellence’ can be roughly used as proxy.
Does New Zealand’s rate of intranational citations balance our lagging overall ranking?
| Country | Intranational citations per publication | International citations per publication |
| New Zealand | 1.25 | 5.95 |
| Denmark | 1.70 | 8.35 |
| Finland | 1.46 | 6.87 |
| Ireland | 1.13 | 7.05 |
| Israel | 1.23 | 6.98 |
| Singapore | 1.35 | 7.82 |
| Mean average | 1.35 | 7.17 |
It’s possible that New Zealand produces publications which are more relevant and therefore cited more within our own country than they are in other countries; we just don’t cite enough to pull up our average very far, but this is conjecture.
In any case, does New Zealand do well enough by intranational citations to let us off the hook of general lack-of-excellence? Well, we certainly have room for improvement. The next question is, obviously, how to improve – a subject for another article, where we examine government investment and its effect on the science sector.
Look out for our next episode in the New Year, and may the force be with you over the holidays!
*Featured image by XKCD comics.
Call for nominations for Software Carpentry Instructor Training
New Zealand eScience Infrastructure (NeSI) is pleased to announce the offering of a Software Carpentry Instructor Training workshop at the University of Auckland, 28-29 January 2016 and would like to invite candidates from Te Pūnaha Matatini. This workshop kicks off our 2016 training programme, which is quickly followed by Research Bazaar 2016 (ResBaz), and presentations by key international training leaders at eResearch NZ 2016.
Software Carpentry is an international initiative to upskill researchers, in research computing skills to help them be more productive. It is usually delivered in the form of a two-day highly-interactive workshop, and has seen great successes worldwide.
NeSI, the national leader in High Performance Computing, is an official affiliate of Software Carpentry Foundation, and in partnership with several institutions across the sector we have delivered a series of Software Carpentry workshops nationwide during 2015. We are seeing great demand for research computing training in New Zealand’s research community, with many events sold out within a few days.
We are fortunate to have Aleksandra Pawlik from Software Sustainability Institute, UK, here to run a *two-day* intensive workshop to train and certify new instructors. This workshop will cover the basics of educational psychology and instructional design, and look at how to use these ideas to create an effective learning experience.
New certified instructors from your institution will then be authorised to offer Software Carpentry workshops to the local research community on a regular basis, and NeSI will continue to support and sponsor future training offerings at your institution (our sponsorship in the main comes from our membership, which covers the administrative fee otherwise payable to the Foundation).
The Instructor Training workshop is limited to 20 participants. We ask for at most two candidates per institution for the selection process. We expect to confirm selected candidates, and inform them, before the new year.
There are number of considerations to keep in mind when choosing candidates for this workshop:
- A technical/academic staff member or a Ph.D student who is technically capable and experienced in scientific computing will be an ideal candidate.
- Once candidates have been nominated, we will direct them to complete a brief online pre-selection survey which will allow us to select the final group of 20.
If selected, attendees are required to complete a number of tasks prior to attending the Instructor Training workshop.
- Newly trained Instructors must commit to running/teaching at 2 workshops within 8 months upon completing instructor training, with the first workshop within 3 months.
These requirements are in place so together we can build an effective team of local Instructors committed to putting their skills into practice.
Nominate candidates by emailing georgina.rae@nesi.org.nz with “Call for nominations for Software Carpentry Instructor Training” in the subject line before Wednesday December 16th – include the names and contact emails for your candidates.
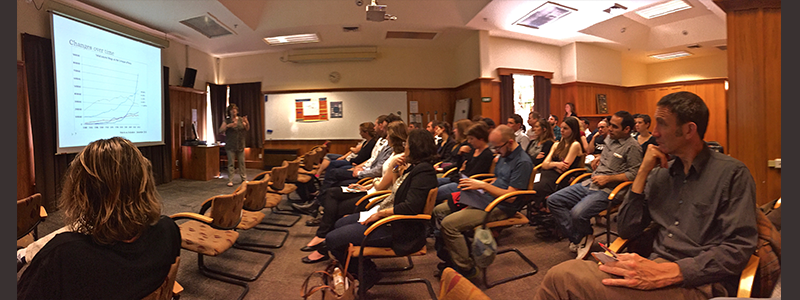
Our December Hui
By Dr Rebecca Ford
Last week I attended the Te Pūnaha Matatini Investigator Hui in Christchurch. While this is not the first time the group of academic investigators have come together at such events since the launch of the new Centre of Research Excellence in February 2015, it was my first time meeting the full team of Investigators and Whānau since joining Te Pūnaha Matatini earlier this year. So, on Thursday 3rd December, a group of over 50 academics and students descended on Canterbury University (who graciously hosted our rowdy crew – thank you!) for two days filled of intellectual stimulation, innovation, networking, debate, fun prizes, and good food and beer!
Although I came to the hui with some ideas about the work being conducted by Te Pūnaha Matatini investigators, I left with a much richer appreciation of what makes it pretty unique in today’s world and the opportunities afforded by being part of Te Pūnaha Matatini.
I have been an academic (post PhD) for nearly 5 years and one of the main issues I have noticed during this time is that, as academics, we are often constrained in our thinking and research by the disciplinary boundaries within which we are employed and evaluated. These boundaries are artificially constructed – nature does not operate within disciplines – and can be troublesome when trying to tackle some of the key environmental, social, and economical problems we’re seeing in the world today.
Interdisciplinary and integrative research is absolutely vital if we are to better understand and guide socio-technical and socio-ecological transitions toward more sustainable futures, and a key part of Te Pūnaha Matatini’s uniqueness is that the academics involved have interests and expertise spanning various aspects of the environment, economy, and society – from knowledge and innovation in business to the evolution of the universe, from environmental management to bed-bugs. And more so, these creative minds are actively seeking out conversations, research topics, and methodologies that span the traditional disciplinary boundaries that so many shy away from.
In my own research I am lucky enough to work with an interdisciplinary research team, inclusive of engineers, computer scientists, physicists, sociologists, psychologists, economists, and modellers. Since our research program kicked off just over three years ago, I have observed our team go through the four stages of development – forming (transitioning from individual to team member), storming (intra-team conflict and resistance of self-change), norming (acceptance of team norms, personal roles, and idiosyncrasies of fellow members), and finally performing (diagnosing and solving problems, making decisions).
All too frequently teams try to rush through the non-productive form, storm, and norm stages. While this may be a seductive idea to get to the performing stage more quickly, it is ultimately dysfunctional. Groups, just like people, need time to develop and find maturity to tackle complex problems. The Investigator Hui allowed Te Pūnaha Matatini’s teams to share concerns, ideas, and expectations; providing the space needed to develop trust, and gain individual and interpersonal insights – key building blocks to establishing highly performing research groups. And while perhaps not much work was directly achieved, the time spent together engaged in team conversations, celebrating each other in the award ceremony, drinking and eating, and learning about patent data, sexism in science, and bed-bugs in New Zealand Department of Conservation huts has served to strengthen our relationships, provide an opportunity to network, and enabled future planning; ultimately creating the space for the magic to happen.

As I reflect back on our two days in Christchurch, I am grateful to be part of such an engaged, interesting, and open community; Te Pūnaha Matatini really is ‘the meeting place of many faces’ from many backgrounds and with many interests, and I look forward to observing and contributing to the unfolding future of the Centre, working together to tackle some of New Zealand’s (and the world’s) complex problems across environmental, societal, and economical issues.
NSSI (Not Such a Silly Idea… but do it properly) #3
By Catherine Webb and Nicola Gujer
The adventures in data-sleuthing continue. In this blog series, two summer students examine the National Statement of Science Investment 2015-2025, and appraise its use of data. So far we have found one case of partially-correct-yet-misleading-ness, and another of axis-labelling-deficit. This time we take a look at Academic-Corporate Collaboration.
On page 17, the NSSI makes an intriguing statement: “Only 3.2 per cent of New Zealand publications have academic and corporate affiliations, suggesting scope for more collaboration.” We asked, where did this information come from? By what standard do we have ‘scope for more collaboration’? And is that a good standard to use?
Implicit in that statement is the assumption that an abundance of academic-corporate collaboration is a good thing – a claim to be investigated later on.
Firstly, we found that the “3.2%” used in the NSSI is found under ‘Academic-Corporate Collaboration in New Zealand’ on SciVal. The first thing we noticed was that this statistic does change over time, although it fluctuates less than field-weight citations. From the time it was retrieved for the NSSI published in October and the time we checked it in November, it had already fallen to 2.6% (that’s around a 19% drop). Hence, we wanted to check out how stable this measure is over a longer period of time.

We didn’t find anything very remarkable in that regard: on average, the academic-corporate collaboration rate of each small advanced economy deviated about 17% from its initial value over five years, with New Zealand squarely on the mean (+16.7%).
This also helps us answer the second question, ‘compared to what do we lack collaboration?’ The graph shows how our nation’s academic-corporate collaboration measures up to that of other small advanced economies (SAEs); Denmark, Finland, Ireland, Israel and Singapore (widely accepted as comparative countries due to similarities in factors that affect science performance). Using the same measure, this is the data as it stands in Nov/Dec 2015:
Percentage of publications with both academic and corporate affiliations:
| New Zealand | 2.6% |
| Denmark | 4.8% |
| Finland | 2.5% |
| Ireland | 2.7% |
| Israel | 3.3% |
| Singapore | 2.0% |
| Mean average | 3.0% |
We see that by this standard, NZ is below average, but not markedly. We are still above Singapore and Finland, and with our ‘3.2%’ measured earlier in the year, we would have been above the present average!
Presumably, when the NSSI claims that New Zealand is lacking collaboration, they are using the small advanced economies as a reference – they cannot be referring to the worldwide percentage of academic-corporate collaboration, as that is only 1.34%. And yet, if they are comparing us to other SAEs, we are near the average and certainly not significantly underperforming.
Finally, however, we found a significant problem with the New Zealand statistics on SciVal. Academic-corporate collaboration is defined as at least one academic institution and one corporate (business) institution being affiliated with the same publication. On SciVal we found evidence that Crown Research Institutes (which are government entities and not private businesses) are being counted as corporate organisations. Here is one example of a paper listed as an academic-corporate collaboration:

As you can see, the only contributors to this paper are universities and two Crown Research Institutes; AgResearch and Landcare Research. Although our Crown Research Institutes have been ‘corporatised’, meaning that they are managed much like businesses, New Zealand is unique in this respect. Many countries have government science research organisations – the equivalent of our CRIs – but which are treated as purely public government institutes, such as the CSIRO in Australia. This presents an obstacle in drawing conclusions from this data set: comparing academic-corporate collaborations between countries is problematic when New Zealand calls corporate what other countries call government.
This inclusion of CRIs as corporations is skewing the total stats on collaboration in New Zealand, but by how much it is difficult to tell. Unfortunately, it is not possible to find the collaboration data adjusted to exclude CRIs on SciVal. CRIs cannot be excluded from the affiliation search without excluding papers with genuine collaboration between universities and corporations. SciVal’s lack of Boolean operators makes more nuanced searches impractical. Thus, we cannot provide a more correct number for New Zealand’s academic-corporate collaboration percentage than that published in the NSSI. But what we can say is that the NSSI’s number is not accurate, and when CRIs are excluded, NZ’s true academic-corporate collaboration percentage should be, in fact, lower than the NSSI reports.
We have to trust that a similar mistake has not been made in SciVal’s database for any other of the small advanced economies. Without a better dataset we cannot draw any conclusions about the potential for improving academic-corporate collaboration in New Zealand. If anything, this project has highlighted the need for comprehensive data-keeping, as well as taking care in how it is used.
*Featured image by XKCD comics.
NSSI (Not Such a Silly Idea… but do it properly) #2
By Catherine Webb and Nicola Gujer
In this blog series we pull apart the National Statement of Science Investment and scrutinise its use of data. In case you missed it, in our last post we checked out the graph on page 19, and what it says about New Zealand’s academic performance. This time we’re taking a look at page 18… because science.
Published on page 18 of the NSSI was a graph (Figure 1) representing “Academic Output” for New Zealand showing the amount of publications in each discipline and the quality of the output which was shown using field-weighted citation impact. We actually liked this graph; it seemed to show the information it claimed to (which sadly cannot be said about some of the other graphics in the NSSI). Alas, there was no numerical data or scale to be found on the graph. Yes, it showed the disciplines relative to each other, but surely adding a few values to an axis would make this a more effective graph. So recreating this graph, all it needed was a little sprucing up with some numbers and she’d be right (see Figure 2).

Figure 1. NSSI Academic Output (edited to show the “Multidisciplinary” field) (NSSI, 2015)

Figure 2. Volume and quality of academic output for New Zealand between 2010-2014 (Scival, 2015).
While recreating this graph, we came across the same issue as the NSSI with the data lower down becoming too small to be able to fit any labels to it. Unfortunately, this is just what will happen with this data, as the largest amount of publications is 19,993 for “Medicine” and the smallest amount is 401 for “Dentistry”. There is such a large gap between these that yes, it will be hard to have them both clearly visible and labelled.
A feature of this graph that definitely could have used some explanation would be the mean quality of output of NZ and SAEs. At first glance we thought the two averages were weighted by the quantity of publications in each field, since if we look at the NZ line it did not seem balanced by quality alone. Upon further examination of the graph, we noticed that the thin line towards the bottom of the graph was in fact “Multidisciplinary” (an annoyingly large number yet again). So this would explain why our average seemed larger. The mean lines that we have included on our graph are computed using a publication weighted mean. We are not exactly sure what MBIE did as we are not working with the same data as citations have accumulated over time.
These averages also raised the question of how accurate or even necessary these lines are. The lines shown represent the mean quality of output, but the distribution of citation counts for individual papers do not usually follow a normal distribution. Rather, citations tend to better fit a shifted power law distribution as the majority of publications may receive minimal or no citations, while a few highly cited publications will receive even more since when a publication is referenced often, awareness of it grows. This skewness increases over time meaning these average lines become less accurate. It is also likely that the amount of skewness differs between disciplines. A consequence of the skewed distribution is that the mean becomes a poor measure of the “average” value of the distribution. For heavy-tailed distributions, like a power law, the mean value will tend to be much larger than the median. This means that any statistics that are weighted by the mean will also be skewed. This makes it problematic to compare the average of New Zealand with the average of other small advanced economies, since the Field-Weighted Citation Impact does a poor job of normalising across fields.
Another difficulty in using citations to measure the quality of output is that while papers are usually highly cited when other researchers agree with their statements or use them to support their own research, high rates of citation can also occur for controversial or incorrect statements. Unfortunately, there doesn’t seem to be a more effective way of measuring quality of scientific publications so for now, we are stuck with our flawed metrics. Scientists do seem to love a sneaky approximation here and there.
*Featured image by XKCD comics.
NSSI (Not Such a Silly Idea… but do it properly) #1
By Catherine Webb and Nicola Gujer
In October, the MBIE published an interesting document: the National Statement of Science Investment 2015-2025. It is intended to assess New Zealand’s strengths and weaknesses in research and development, and inform science funding for the next decade. As scientists, this document could impact our future, so it’s understandable that it has generated dialogue, especially about its use of data.
Among the NSSI’s many attractive graphics, this graph (Figure 1) in particular, which compares the impact of New Zealand research with that of a number of similar countries, has generated active discussion. A number of people have commented on social media about how poorly we do in multidisciplinary science compared to Denmark, Israel, Finland, Ireland and Singapore. We wanted to look a little deeper into what is going on.

Figure 1. Academic output quality of small advanced economies by field (NSSI, p. 19, 2015)
This data is taken from SciVal, Elsevier – a tool for analysing publications and citations – which is part of the Scopus database. The data is also field-weighted, meaning it is normalised to make different fields comparative.
The “percentage of publications in the top 10% of citations by field” is used here as a measure of the excellence of a country’s academic output. The greater the proportion of Denmark’s maths papers that make it into the most cited 10% of maths papers worldwide, the more excellent Denmark is at maths.
This seems like a reasonable measure, and it’s easy to see New Zealand has a concerningly left-heavy position on the scale. But does the graph really say, as the NSSI claims, that we need to up our game in almost every field to be as ‘excellent’ as our comparative countries?
We set out to pull apart this data, go back to the source, and check out how reliable this information is.
The first issue we encountered was the field labelled “Multidisciplinary”. As you can see, in all six countries, this field out-streaks the others where citation excellence is concerned. This made us wonder what “Multidisciplinary” actually means here – are these small countries all so good at collaborating across different fields?
As it turns out, “Multidisciplinary” publications seem to be labelled according to the nature of the journal they are published in, not because of any cross-field collaboration within the paper. For instance, this category includes papers that are published in the multidisciplinary journals Nature and Science, as well as more unusual choices such as Vaccines and the Journal of Chaos and Bifurcation Theory. Because a few multidisciplinary journals like Nature and Science are extremely highly cited, the citation impact distribution of “Multidisciplinary” publications is skewed to the right, so field-weighting (which is basically an arithmetic mean) does a poor job of normalising the top 10%. Thus, the field receives a confusingly high excellence score.
The second issue is more significant. We wanted to know how stable and consistent these field rankings were across the years, so we went back to SciVal to check. We discovered two things: firstly, due to the dynamic nature of citations, the data we retrieved this November on publications from 2013 was already different to the data on the very same 2013 publications that was gathered earlier this year (for use in the NSSI).

Figure 2. Change in 2013 data on output quality ranking of science fields in New Zealand between data retrieval in November 2015 (right) and earlier in 2015 (left). (SciVal November 2015, NSSI)
In a matter of months, the ranking of many fields has changed significantly. This caused us to question whether the trend stabilises over a matter of years. Discovery number 2: no, it doesn’t.

Figure 3. Change in academic output quality ranking of New Zealand science fields over five years. (SciVal November 2015)
This is a graph to show how the order of which fields New Zealand is most ‘excellent’ in has changed unpredictably, and has not stabilised over 5 years. We can infer that the graph on page 19 of the NSSI may be an accurate snapshot of the data at the time it was taken (except for that remarkable multidisciplinary field), but the data moves so quickly that this type of graph cannot reflect any meaningful trends in the order of fields.
That said, the SciVal data does have some information to offer.

Figure 4. Percentage of small advanced economies’ academic output falling within the 10% most cited academic output worldwide, by field, averaged over five years. (SciVal November 2015)
This is a remake of the NSSI graph, using averaged data over five years (2010-2014). The order of fields is different from the graph that MBIE published, as we would expect from what we have seen so far. However, this is similar to the NSSI graph in that New Zealand on average scores notably lower than other small advanced economies.
So does the graph say what it claims to say? With a bit of tweaking, it could. It cannot give us any meaningful information about which fields NZ is doing best or worst in, because that can change within months. However, if expanded to more years than 2013, it does show that NZ consistently produces a lower percentage of globally top-quality papers than comparable countries.
Whether papers being in the top 10% of citations in the world is a good way to measure science excellence or not – that’s a question for another day.
*Featured image by XKCD comics.

Adam Jaffe at ISPIM15
 Adam Jaffe, our Theme Leader in Complex Economic and Social Systems is giving one of the keynote speeches at the ISPIM Innovation Summit in Brisbane.
The Summit runs 6th – 9th in December
The talk is titled: “Golden Goose or Sacred Cow: Evaluating the Impact of Public Research Support Programmes”
Public support of scientific research and technology development is common in advanced economies. There is a good theoretical case for such support, because the social rate of return to investments of this kind is high, and there are a number of reasons why private firms under-invest. But there is little evidence as to how much beneficial effect such programmes have. Simply pointing to scientific or commercial successes funded by the programme is not evidence of policy success, unless we can know or infer the extent to which the observed success would not have occurred with public support. We should be undertaking systematic evaluation of these programmes. This raises difficult issues of measurement and inference. This talk will discuss those issues and provide examples of attempts to overcome them.
Innovation NZ Symposium
 Our Director Shaun Hendy will be attending the Innovation NZ Symposium 2015. It’s a symposium on Growing more Innovative and Productive Kiwi firms.
Catch Shaun on the panel December 1.